
Has Axial Seamount erupted yet?
No, not yet.
Did you attend Marine Science Day at OSU-HMSC in April 2025? Scroll down to the bottom to see your guesses of when Axial Seamount would erupt next!
Here's the latest inflation forecast plot (updated once a day):
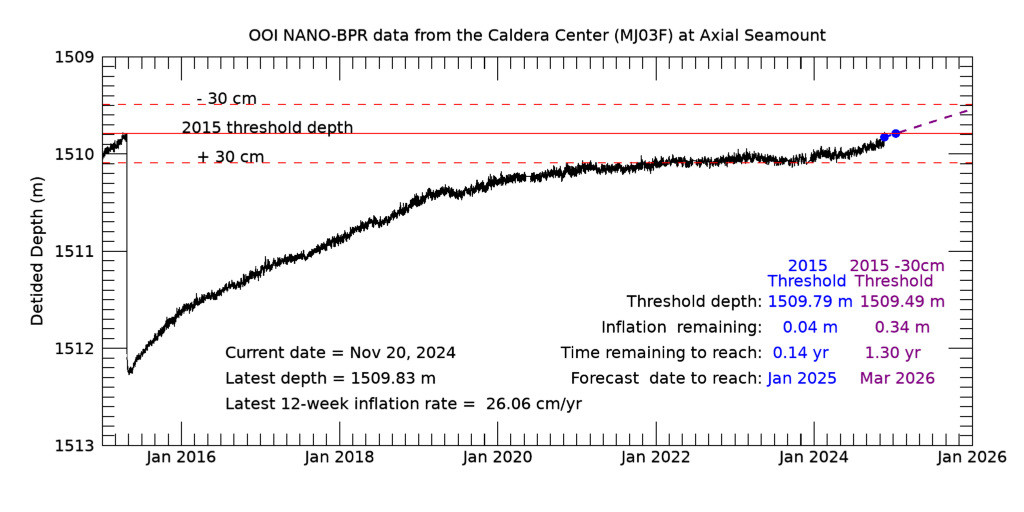
The plot above shows the vertical motion of the seafloor at the center of Axial caldera, as the volcano "inflates" and "deflates". Moving up on the plot is inflation caused by magma accumulating inside the volcano. Downward motion on the plot is deflation, which occurs during eruptions. The big downward drop at the left edge of the plot is the deflation that occurred during the last eruption in 2015 (2.5 meters or 8 feet of subsidence!). The next eruption will cause a similar drop of the seafloor (deflation) on the right side of the plot, which is updated once a day with data being transmitted back to shore in real-time by a fiber-optic cable. This is one way of showing whether or not the volcano has erupted yet.
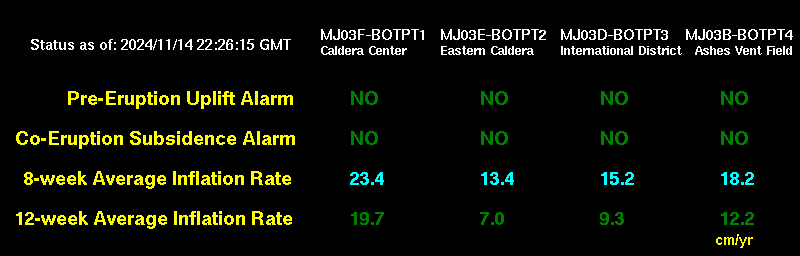
Alarm Status & Inflation Rate Summary Table (updated every 15 minutes):
Another way to tell if Axial Seamount is erupting is to look at the table below, which is updated every 15 minutes and shows the current status of event-detection alarms and inflation rates from four monitoring instruments at the volcano. The alarms are for two types of events: (1) pre-eruption rapid uplift (rate of depth change > +10 cm/hr over the last 20 mintues), or (2) co-eruption rapid subsidence (rate of depth change < -10 cm/hr over the last 20 mintues). If one of these is detected, the "NO's" will turn to "YES's".The table also includes the latest inflation rates calculated from the previous 8- and 12-week time periods, updated daily.
The plot and table above are part of the monitoring of Axial Seamount by the The Ocean Observatories Initiative (OOI) Regional Cabled Array (RCA), operated by the University of Washington and funded by the National Science Foundation (NSF).
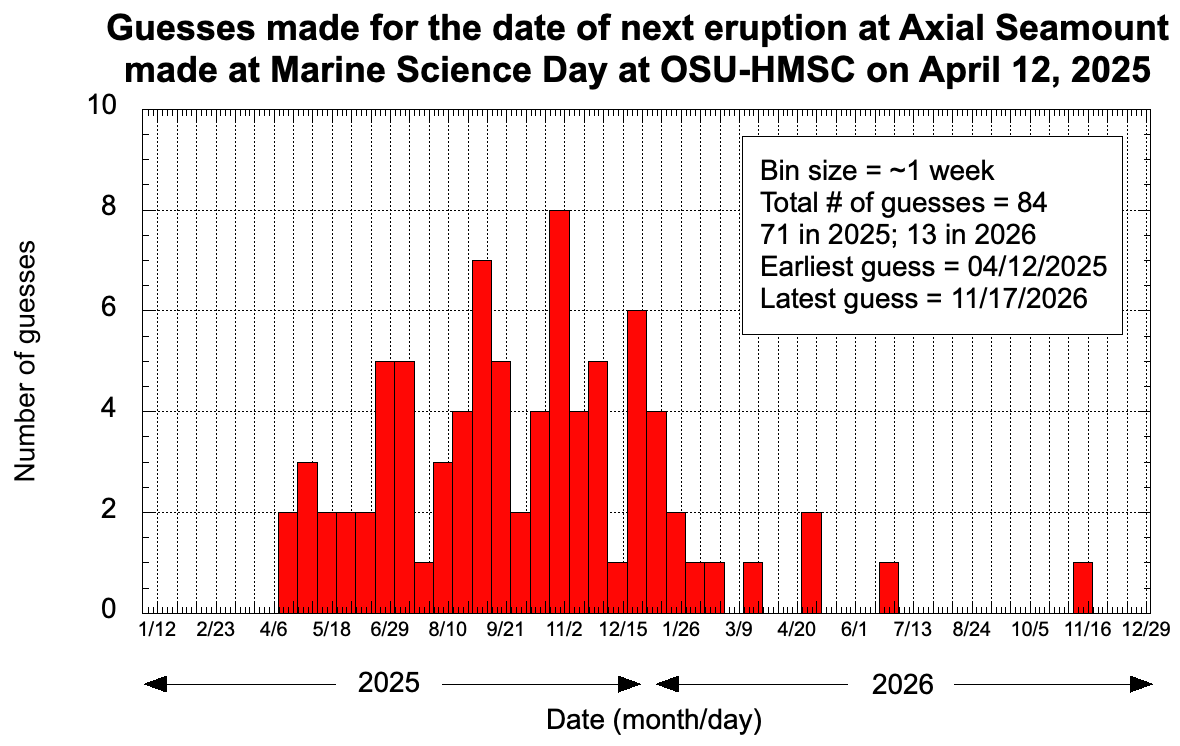
At the Hatfield Marine Science Center's Marine Science Day on April 12, 2025, 84 people stopped by to make a guess about when Axial Seamount would erupt next. The plot above shows the range of dates that were guessed, from 04/12/2025 to 11/27/2026.