
Realtime data from International District Seafloor CTD
(MJ03D-CTDPFB307)
This page displays plots of realtime data (updated every 15 minutes) from the seafloor CTD instrument located at the International District at Axial Seamount, part of the National Science Foundation's (NSF) Ocean Observatories Initiative (OOI) Regional Cabled Array (RCA), operated by the University of Washington. The seafloor CTD at the International District was installed in summer 2024. The instrument samples at 1 Hz, but the data are downsampled to every 1 minute in the plots below. The dates/times in the plots below are in GMT (+8 hrs of local PST, or +7 hrs of PDT time on the US west coast).
LINK BACK TO MAIN PAGE
Temperature data
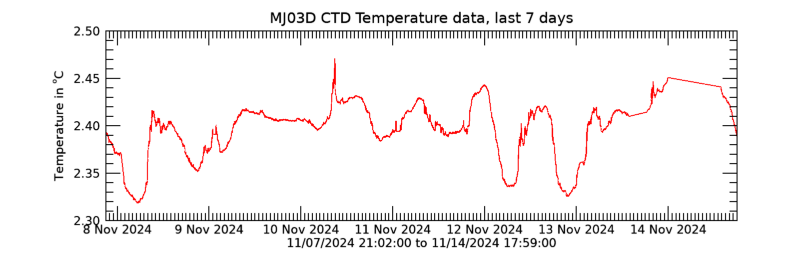
Plot 1: CTD temperature data, over the last 7 days, updated every 15 minutes.
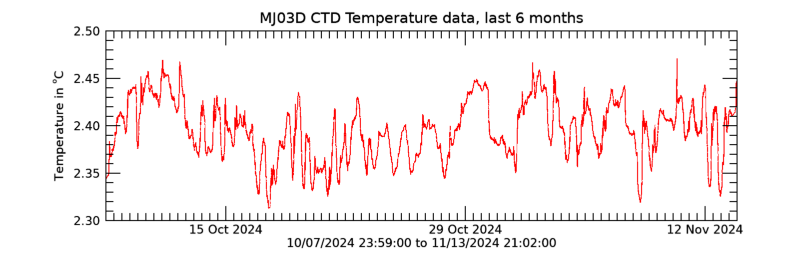
Plot 2: CTD temperature data, over the last 6 months. ONLY UPDATED ONCE PER DAY.
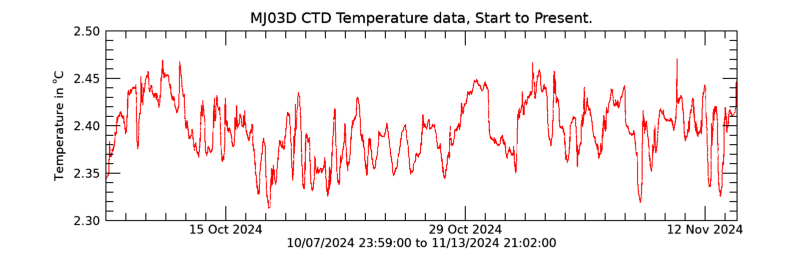
Plot 3: CTD temperature data, over the entire record. ONLY UPDATED ONCE PER DAY.
Salinity data
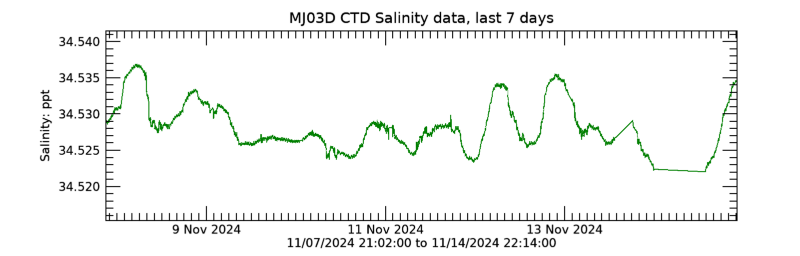
Plot 4: CTD salinity data, over the last 7 days, updated every 15 minutes.

Plot 5: CTD salinity data, over the last 6 months. ONLY UPDATED ONCE PER DAY.
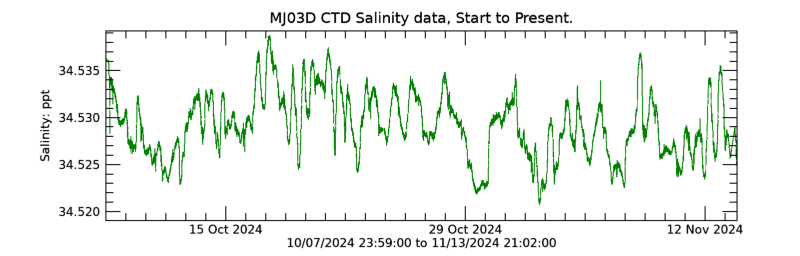
Plot 6: CTD salinity data, over the entire record. ONLY UPDATED ONCE PER DAY.
Density data
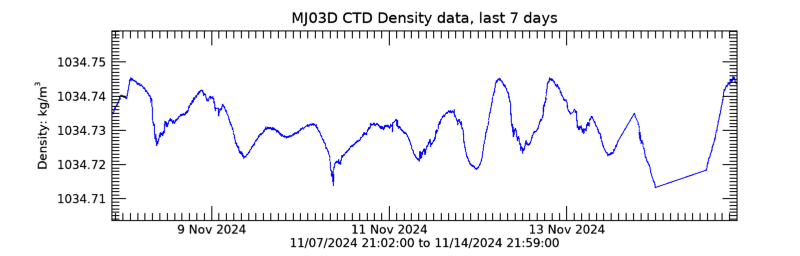
Plot 7: CTD density data, over the last 7 days, updated every 15 minutes.

Plot 8: CTD density data, over the last 6 months. ONLY UPDATED ONCE PER DAY.
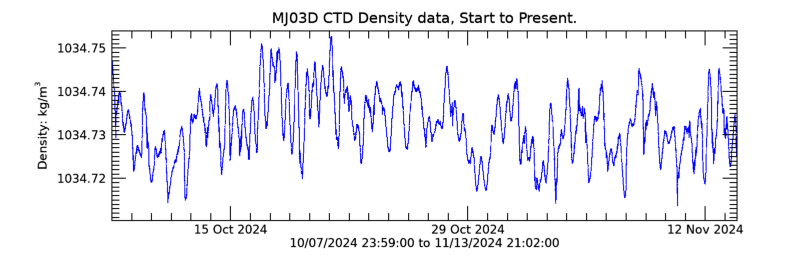
Plot 9: CTD density data, over the entire record. ONLY UPDATED ONCE PER DAY.